There is no official list of the worst schools in Australia, and any ranking that claims to be one is built on a single measure. When people call a school "worst", they usually mean one of five things: low NAPLAN results, a disadvantaged student intake, poor behavior data, a high student-teacher ratio, or a bad reputation. NAPLAN and ICSEA suit parents comparing nearby schools. Behavior data suits families who worry about safety. Ratios suit anyone who cares about teacher attention. Reputation stories suit readers who want the full context behind a headline.
The problem is that searches like worst high schools in Victoria or the worst school in Melbourne return opinion threads and video rants, not data. Those posts mix test scores, gossip and old headlines. A school can look weak on one measure and solid on another, and a single list hides that.
This guide names no school as the worst. Instead it walks through the five data points behind the labels, shows what each one measures, where it misleads, and where you can check it yourself. If you are a student or parent weighing a school in Australia before you move, you can use it to read any "worst schools" list critically. Study Abroad Nations covers admissions and application guidance for students planning to study abroad.
1. NAPLAN results: who is falling behind
NAPLAN is the national test behind most "worst school" claims, and it suits parents comparing nearby primary schools. It is useful, but only when you read it with context.
What the data shows
NAPLAN tests students in Years 3, 5, 7 and 9 in reading, writing, language conventions and numeracy. Since 2023, results fall into four proficiency levels: Exceeding, Strong, Developing and Needs additional support. ACARA, the national curriculum and reporting body, publishes each school’s results on its My School website.
At state level, the Northern Territory usually records the lowest averages. That is the honest answer if you wonder which state has the lowest rated schools. Much of the gap comes from remote communities and entrenched disadvantage, which is why you should not read the result as a verdict on every classroom in the territory.
Where the label misleads
Small year groups swing wildly. A Year 3 cohort of 15 students can drop a full band because two or three children had a bad testing week. Raw scores also reflect where students start, not how much a school has moved them.
A low NAPLAN score shows where students are, not how far the school has taken them.
2. ICSEA: comparing schools with similar students
ICSEA is the fix for unfair NAPLAN comparisons, and it suits anyone who wants a fair read on a school serving a disadvantaged area.
What the data shows
ICSEA stands for Index of Community Socio-Educational Advantage. It sets the national average at 1000, with a standard deviation of 100. It draws on parents’ education and occupation, the school’s remoteness, and the share of Indigenous students.
| ICSEA score | What it means |
|---|---|
| About 900 | One standard deviation below average, more disadvantage |
| 1000 | National average |
| About 1100 | One standard deviation above average, more advantage |
My School uses these scores to compare a school with statistically similar schools. A school that scores below the national average but matches or beats its similar group is doing well.
Where the label misleads
Lists that ignore ICSEA mostly rank disadvantage, not teaching. Teachers who trade school rankings online make a related point: quality varies inside one school. The same building can run high-performing senior classes and struggle with others.
Ranking schools without adjusting for intake mostly ranks neighborhoods.
3. Behavior data: suspensions, safety and discipline
Behavior data drives the loudest headlines, and it suits families whose first worry is safety. It is also the hardest data to compare across states.
What the data shows
Education departments report suspensions, exclusions, attendance and, in some states, staff assaults. One media analysis in south-east Queensland ranked state high schools by behavior, and lists like it spread fast. At national level, the OECD’s PISA 2022 results showed Australian 15-year-olds falling in maths and reporting a disciplinary climate weaker than the OECD average. In the same round, Australia scored ahead of the United States in maths and science, so the US system is not clearly better.
Where the label misleads
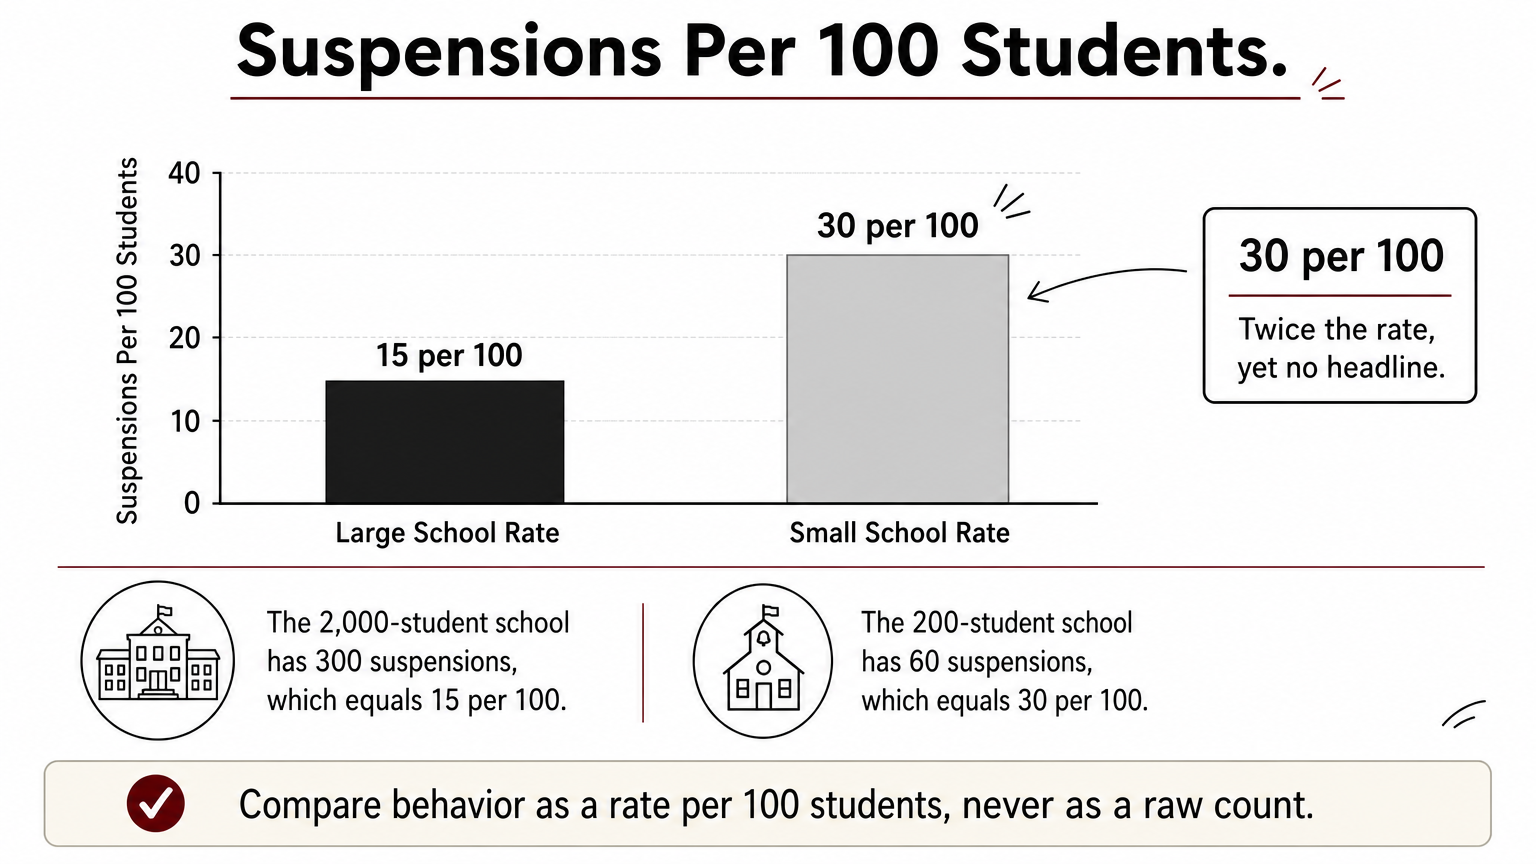
Raw counts punish big schools. Say a school with 2,000 students records 300 suspensions, which is 15 per 100 students. A school with 200 students and 60 suspensions sits at 30 per 100, twice the rate, yet it never makes a headline. A high count can also mean a school enforces its rules consistently.
Compare behavior as a rate per 100 students, never as a raw count.
4. Class sizes and student-teacher ratios
Ratios are the easiest number to find and the easiest to misread, and they suit parents who care about teacher attention for younger children.

What the data shows
My School lists students per full-time-equivalent teaching staff member. That is not class size. The figure includes specialist and support teachers, so actual classes run larger than the ratio suggests. A school with 450 students and 30 full-time-equivalent teachers has a ratio of 15 to 1, but individual classes can still hold 25.
Where the label misleads
Reporting errors can wreck a ratio. If the data credits the same 450 students with only 18 full-time-equivalent teachers, because staff are split across campuses or recorded wrongly, the ratio jumps to 25 to 1. A national media analysis put a Catholic primary school at the top of its ratio list, and the coverage itself pointed to a quirk in how ACARA’s data splits teachers.
A striking ratio is often a data error until the school confirms it is not.
5. Reputation and turnaround stories
Reputation is the weakest data and the strongest label, and it suits readers who want context more than a number.
What the data shows
Bairnsdale Secondary College in regional Victoria was once called "Australia’s worst school" in media coverage. Reports described staff who had been assaulted. Later coverage, including a podcast and a video, describes how the school changed its trajectory. At the other end, selective schools such as James Ruse Agricultural High School in Sydney regularly top NSW results lists. They admit students by entry exam, so their rankings reflect selection as much as teaching.
Where the label misleads
A label from one bad year can stick for a decade. Check any school yourself:
- Open its My School profile and note the ICSEA score.
- Compare results with similar schools, not the national average.
- Look at several years of trend data, not one year.
- Ask the school for its behavior policy and attendance rate.
- Visit in person, or ask current families.
A school’s reputation is often years older than its current results.
Reading school rankings with care
There is no single list of the worst schools in Australia, because no single number can measure a school. NAPLAN shows student results, ICSEA shows how fair that comparison is, behavior data shows safety when read as a rate, ratios show staffing when the data is correct, and reputation shows history. Use all five together, and trust trends over snapshots.
If you are choosing a school or planning to study in Australia, start with the My School profile, then compare similar schools. For more practical help with admissions abroad, browse the guides at Study Abroad Nations.